Visual regression testing

Screenshot your pages
before and after a change.
See every difference.

Side By Side loads the pages you pick, on every environment and screen size, and compares each one with the version it captured before your change — so you find what moved, broke or disappeared before your clients do.

BeforeBaseline After What changedComparison
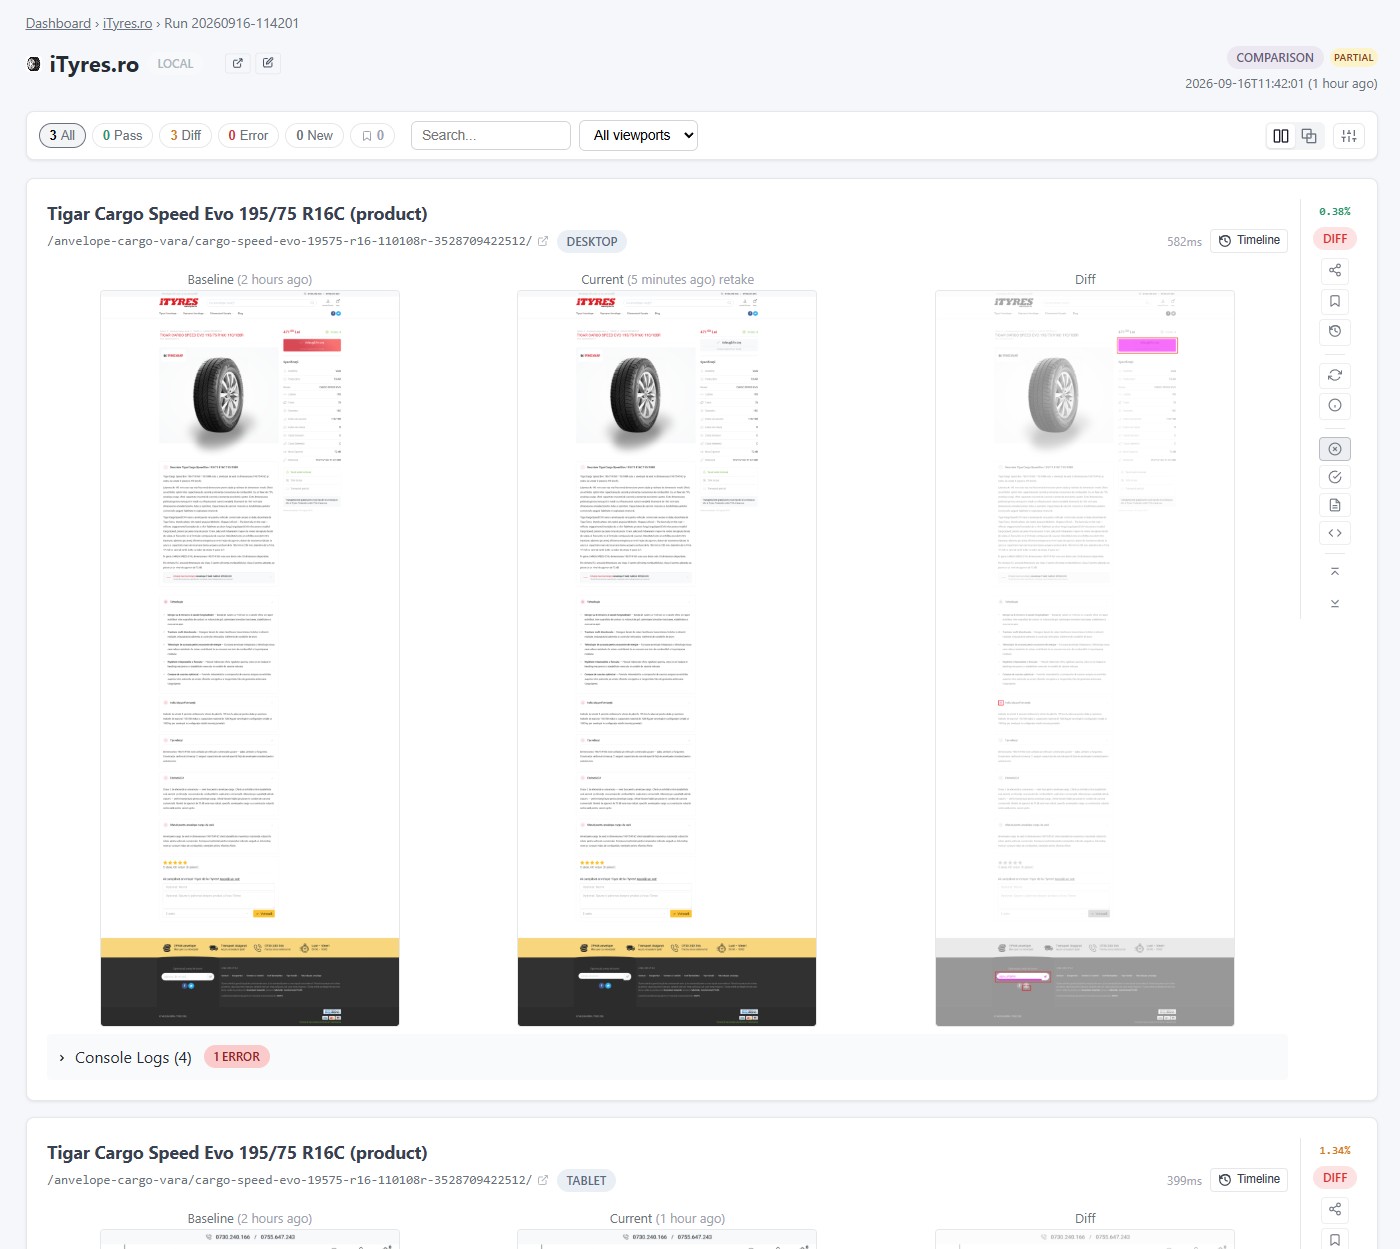
A comparison run: result filters, and one page shown as baseline, current and diff with its console log count.
For every page and screen size: the baseline, the current version, and a diff highlighting the changes, with console errors underneath.

How it works

Side By Side compares a page with its own earlier self. That earlier version only exists if you captured it first.

Side By Side does this You do this

  1. Add your site and pages Give it a URL for each environment, then pick the pages to watch.
  2. Baseline It loads your pages and stores them as they are now. before your change
  3. Your change Deploy, update a plugin, edit content. Nothing about your work changes.
  4. The same pages again Same URLs, same screen sizes, same environment. after your change
  5. The difference What moved, broke or disappeared, highlighted page by page.
  6. Review results Mark each difference as intentional or as a bug, and share the run.

The baseline has to come first. There is no way to compare a page you never captured — and nothing here compares a design against a build.

What it does

Visual diffs

Every page and viewport compared with a baseline, changed regions highlighted.

Shift detection

Content pushed down the page is reported as a shift, not as a broken page.

Console errors

JavaScript errors and failed requests from every page it loads.

Every environment

Production, staging and dev, including sites behind HTTP auth or a VPN.

Recorded interactions

Open menus or dismiss banners before the screenshot, recorded with the Chrome extension.

Alerts

An email when a run finishes, and another when it finds differences.
BeforeBaseline After What changedComparison
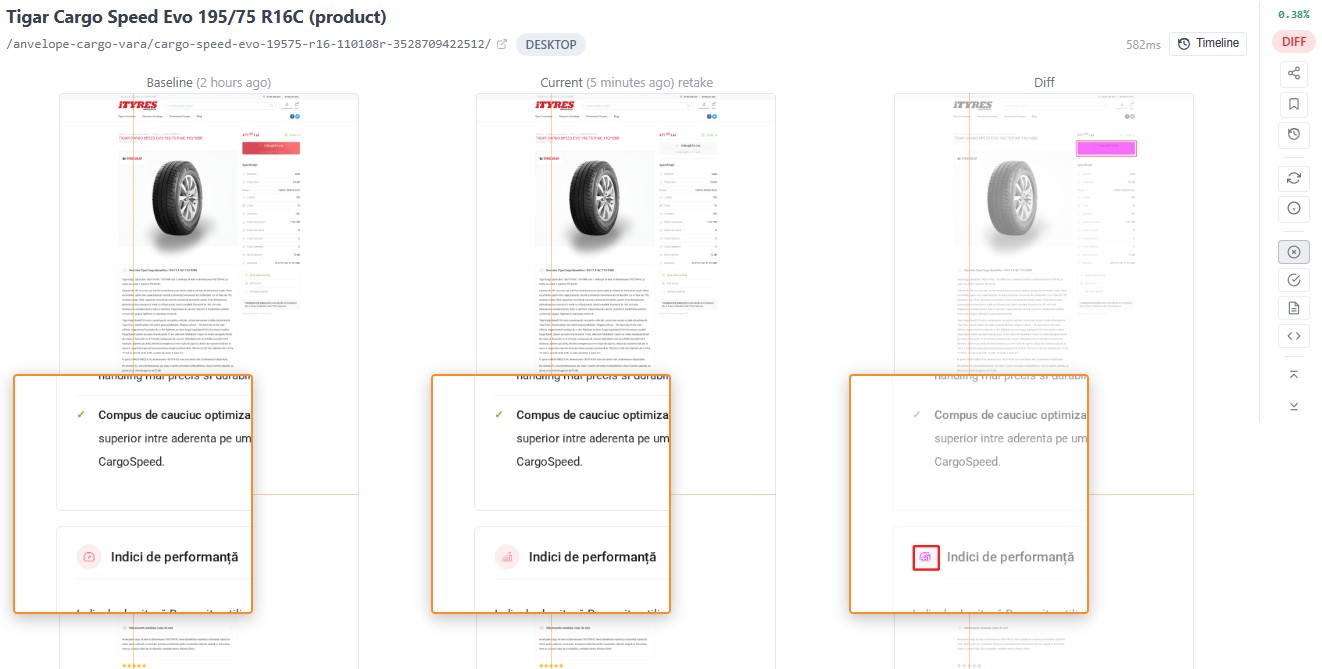
Baseline, current and diff screenshots side by side, magnified on the same spot in all three.
Hover over any part of a screenshot to magnify the details. The same spot is magnified in baseline, current and diff.

FAQ

Do I need to install anything on my site?

No. It loads your pages like a visitor would.

Can it compare my design against the page that was built from it?

No. Every comparison is one page against the version of that same page it captured earlier. A mockup is not something it can load and capture, so there is nothing for it to compare the build with.

Can it compare staging against production?

No. Each environment is measured against its own baseline: a staging run is compared with an earlier staging capture, not with production. A comparison that names a baseline from a different environment is refused.

Can it compare my site with someone else's?

No. It only captures pages you have added to your own account, and only ever compares each one with its own earlier capture — never one page against a different page.

Does it test that my site still works?

Not in the sense a test suite does. It reports how every page looks and the JavaScript errors and failed requests it saw while loading them. It does not walk through a checkout, fill in a form or assert that a result is correct, so it sits alongside your functional tests rather than replacing them.

Can it capture a page only I can reach, like localhost?

Addresses that exist only on your own machine or network — localhost, 127.0.0.1, 192.168.* — are refused by the capture service, which will not load a private address at all.

For those there is an experimental Chrome extension that captures the page from the browser you are already using, so the page never has to be reachable from the internet. It is still being built and cannot be switched on from your account yet.

Is there a browser extension, and which browsers does it support?

There is one, for Chrome only. It is installed by hand — developer mode in chrome://extensions, then “Load unpacked” — rather than from the Chrome Web Store.

Treat it as experimental. It is limited to administrators of this deployment at the moment, so it is not something you can enable yourself, and there is no Firefox or Safari version.

Does any of this change my site or its code?

No. Nothing is installed on your server, no snippet or script tag is added, and not a file or a line of your code is touched. It loads your pages the way a visitor's browser does and photographs what comes back. The extension works the same way — it reads a page your browser has already rendered.

What counts as one screenshot?

One page at one viewport. Thirty pages on three viewports is 90 screenshots per run.

How do I know when something changed?

You get an email when a run finishes, and a second one listing the biggest differences if it found any.

Who can see my screenshots?

Your captures are private. Nothing is published, listed or indexed anywhere, and no screenshot is public unless you deliberately make it so.

Members of your organisation, and anyone you give a share link to. Each run can have a read-only share link: members can create one from the run page, and the email we send when a run finishes carries one that expires after 30 days. A link opens that run's results, including the baseline screenshots it is compared against, and nothing else in your account. Revoking it from the run page switches off every link to that run, the emailed one included.

Is there a free trial?

Yes: 14 days, no credit card. Some features, like scheduled runs and the REST API, depend on the plan you choose afterwards.

How to use it

Grouped by what you are trying to do. Signed-in users get more of these — the ones about invitations, usage and billing only make sense once there is an account to apply them to.

Getting started

What it does, and how to go from nothing to your first comparison.

What this does, in a minute

It loads the pages you choose in a real browser, photographs them, and keeps the pictures. The next time it runs, it photographs the same pages again and compares each one with its own earlier picture.

What you get is a percentage per page per screen size, and a highlighted image showing where the two differ. A page that did not change reports zero and needs no attention, which is the point: you read the handful that moved instead of clicking through the whole site.

What it is not. It does not check that your site works. It does not fill in a form, walk a checkout or assert that a total is correct. It reports how pages look, plus the JavaScript errors and failed requests it saw while loading them. It sits alongside your functional tests rather than replacing them.

How to use it: from nothing to your first comparison

Five steps. The first four are done once; the last is the one you repeat.

  1. Add the site. + Add Site on the dashboard. Give it a name and the address of the environment you want watched. You can add more environments — staging, dev — to the same site afterwards.
  2. Choose the pages. Open the site and go to its pages. + Add Pages lets you paste addresses in, or crawl the site or its sitemap and tick the ones you want. Start with a dozen that matter rather than everything; you can always add more.
  3. Pick the screen sizes. Each page is captured at each viewport you enable, so two viewports means two pictures of every page. Desktop and mobile is a sensible start.
  4. Take a baseline. Create new baseline. This is the reference set — the "before" that everything later is measured against. Look through it once and make sure the pages came out the way you expect, because a baseline captured mid-deploy will make every later run look wrong.
  5. Compare, whenever you want to know. Compare against baseline after a release, a plugin update, a content change — whenever you want to know what moved. The run captures the same pages again and reports a percentage per page.

After that the loop is: compare, read the handful of pages that changed, and either fix what broke or take a new baseline to accept the new look as the reference.

Production, staging and other environments

One site can have several environments — typically production and staging — each with its own address. The pages you added are shared; the captures are not.

Each environment is measured against its own baseline. A staging run is compared with an earlier staging capture, never with production. A comparison that names a baseline from a different environment is refused, on purpose: staging and production differ for a hundred legitimate reasons and a diff between them would be noise from top to bottom.

Sites and pages

Choosing what gets watched, on which screen sizes, in which state.

Add a site

+ Add Site on the dashboard. You need a name and one address to start; more environments can be added later from the site settings.

Nothing is installed on your server. No snippet, no script tag, no file of yours is touched — it loads the address the way a visitor's browser would and photographs what comes back. That also means the address has to be reachable from the internet.

Choose which pages to watch

Open the site and use + Add Pages. Three ways in:

  • Paste addresses — fastest when you already know the list.
  • Crawl the site — follows links and offers what it finds.
  • Crawl the sitemap — reads the site's XML sitemap.

Either crawl gives you a list to tick, so you decide what is watched; nothing is added behind your back.

Pick deliberately. Every page is captured at every enabled viewport on every run, so the list is what your runs cost and how long they take. One page per template — a product page, not four hundred product pages — catches the same breakages for a fraction of the work. Add the same path twice if you want it captured in two different states; duplicates are allowed and each keeps its own history.

Pick the screen sizes to capture

Viewports are defined once, centrally, and sites refer to them by name — so changing what "mobile" means updates every site that uses it, rather than leaving you to edit each one.

A page is captured once per enabled viewport. One page at one viewport is one screenshot: thirty pages on three viewports is ninety screenshots per run. That is the number your plan's allowance is counted in, so enabling a third viewport across the board is a 50% increase in everything.

A single page can be limited to a subset of the viewports, for the cases where a page only exists on one of them.

Capture a page in a particular state

Some things are not visible on a page as it loads: a menu that opens on click, a state behind a cookie banner, content that only appears once you scroll.

Each page can carry a short list of actions performed before the screenshot is taken — click, hover, scroll, wait, type, or wait for a particular element to appear. They run in order, every time that page is captured, so the baseline and every later comparison photograph the same state.

A cookie banner is the usual first one: dismiss it in an action and it stops covering every page in every run.

Baselines, comparisons and console checks

The three kinds of run, and what happens after you start one.

What a baseline is, and when to take a new one

A baseline is the reference set of pictures every later comparison is measured against. Nothing is compared to "how the site should look" — only to how it looked when the baseline was taken.

Take a new one when a change is intended and you want it to become the new normal. After a redesign, a content refresh, a deliberate layout change. If you do not, every run afterwards keeps reporting the same difference and the real breakages get lost in it.

Do not take one while you are unsure. A baseline captured mid-deploy, or with a cookie banner over everything, becomes the thing all future runs are judged against. Look through a new baseline once before you rely on it.

Older baselines are kept, and a comparison can be pointed at a specific one rather than the latest.

Run a comparison

Compare against baseline on the site. It captures every enabled page at every enabled viewport and reports, for each one, how far it has moved from the baseline.

You can point a comparison at a particular baseline instead of the most recent one, and you can re-compare an existing set of captures against a different baseline without re-photographing anything — useful when you realise afterwards that you were measuring against the wrong reference.

A single page and viewport can be re-captured on its own if one came out badly, without re-running everything.

Check for console errors

A console check loads each page and records the JavaScript errors and failed requests the browser reported, without taking screenshots. It is the cheap run: no pictures, no comparison, just what broke while the page was loading.

It answers a different question from a comparison. A page can look pixel-identical and still be throwing errors, and a failing analytics script or a 404 on a font never shows up in a diff.

What happens after you start a run

Starting a run queues a job rather than making you wait on a page. The work is picked up by machines that load your pages in a real browser, and the run page fills in as results arrive — you can close the tab.

How long it takes depends on how many pages and viewports you enabled and how fast the pages themselves load. A run's expected duration, based on your own previous runs, is shown in Reports.

Reading your results

What a diff percentage means, and what to do with one.

Read a diff

Each page and viewport gets a percentage: how much of the image differs from the baseline. Zero means identical.

The percentage tells you where to look, not whether something is wrong. A 0.2% diff can be a broken price and a 40% diff can be a new hero image you asked for. Open the result and compare: baseline, current, and a highlighted image marking what moved. Hovering magnifies the same spot in all three at once.

Work top down. The largest diffs are usually either deliberate or obvious, and the interesting ones are often the small percentages on pages nobody touched.

Why a whole page shifting down is not reported as a total rewrite

Add a line of text near the top of a page and everything below it moves down. Pixel for pixel, almost the entire page is now different — which is true and completely useless.

Comparisons detect that kind of vertical displacement and report the corrected difference, so a page that merely moved reads as a small change rather than a total one. The raw figure is kept alongside it, and the result is marked as having shifted, so you can still see what happened.

Mark a change as expected, or as a false positive

Two things produce a diff you do not want to see again:

  • A content change — the page really did change, on purpose.
  • A false positive — a rotating banner, a timestamp, an animation caught mid-frame. Nothing is wrong; the page simply is not identical twice in a row.

Marking a result records which it was, so the next person reading the run is not re-investigating something you already settled.

For something that will keep firing every single run — a carousel, a live counter — marking it each time is the wrong fix. Capture the page in a fixed state instead: an action that stops the carousel, dismisses the banner or waits for the animation to settle removes the noise at the source rather than after the fact.

How you find out something changed

You get an email when a run finishes, and a second one listing the biggest differences if it found any. Inside the app, the bell in the sidebar carries the same events.

Each run can also have a read-only share link, for showing a result to somebody without an account. The email sent when a run finishes carries one that expires after 30 days. A link opens that run's results and the baseline it was compared against — and nothing else in your account. Revoking it from the run page switches off every link to that run, the emailed one included.

The Chrome extension

Capturing from a browser you are already signed in to.

What the extension is for, and who can use it

There is one, for Chrome only. It is installed by hand — developer mode in chrome://extensions, then "Load unpacked" — rather than from the Chrome Web Store.

Treat it as experimental. It is limited to administrators of this deployment at the moment, so it is not something you can switch on from your own account, and there is no Firefox or Safari version.

It reads a page your browser has already rendered. It changes nothing on the page and installs nothing on your server.

Recording the steps to reach a page

Writing actions by hand is fiddly when the state you want is four clicks deep. The extension can watch you do it instead, and turn what you did into the action list for that page.

It detects hovers as well as clicks, which is the awkward case: a menu or tooltip that only exists while the pointer is somewhere cannot be reached by a list of clicks alone.

When something looks wrong

Logins, private addresses, and captures that did not come out.

A page that needs a login, or is behind a VPN

A site can carry HTTP credentials, and a page that needs them will be captured with them. For a site that is only reachable through a VPN, a proxy can be configured for the site or for one particular environment — so staging can go over the VPN while production does not.

If captures come back as a login screen, that is what the browser was actually served: the credentials are missing, wrong, or the session they create is not surviving. Check the environment's settings before assuming the capture failed.

Pages only you can reach, like localhost

Addresses that exist only on your own machine or network — localhost, 127.0.0.1, 192.168.* — cannot be reached by anything that is not on that network, so they cannot be captured the normal way. The address has to be reachable from the internet.

Capturing those from your own browser is what the extension is being built for. It is not something you can switch on from your account yet.

A site's bot protection refused the capture

Some sites put a bot-protection service in front of themselves — Cloudflare is the most common. When it is set to challenge automated visitors, it answers with a verification page ("Just a moment...") instead of the page you asked for.

We do not photograph that page. A picture of a challenge screen is not a picture of your site, and storing one would quietly turn into a baseline, or into a 100% difference against one. The result says the capture was refused and names what refused it.

Why only some pages. These services usually check only requests that reach your server; anything already cached at their edge is handed over without a check. So the pages that fail tend to be the less-visited ones, and the set changes between runs. That is why it can look like random breakage rather than a block.

What to do. The fix is on the site's side, and it is one rule: ask whoever manages the site's CDN or firewall to let our monitoring through. We identify ourselves honestly on every request, with this user agent:

SBSBot/1.0 (+https://sbspx.com/bot)

In Cloudflare that is a WAF custom rule matching http.user_agent contains "SBSBot" with the action Skip, applied to bot protection and rate limiting. Other vendors have an equivalent. If the site is hosted on a managed platform, the request may need to go to that host's support rather than to your own dashboard, because the protection belongs to them.

We stop asking. After a few refusals from the same site in one run, the remaining pages are not requested at all. Continuing would not produce a usable run, and it would keep telling that site we are what it suspected. You will see the rest of the run reported as not requested rather than as failures.

A capture came out wrong

Usually one of these, in rough order of likelihood:

  • A cookie banner or overlay over the page. Dismiss it with an action and it stops appearing in every capture.
  • Content that loads as you scroll. A scroll action before the screenshot gives it the chance to load.
  • The page was genuinely slow. A wait, or waiting for a specific element, is more reliable than hoping.
  • A login screen. See the article above — that is what was served.

Re-capture the single page and viewport rather than the whole run once you have changed something; there is no need to re-photograph everything to test one fix.

If it still comes out wrong, send it to us from the help button — a report started from the page in question arrives with the details of that page attached.

Try it on your own site.

14 days free, no credit card. Questions? Contact us.

Start free trial